- Advertising
- Bare Metal
- Bare Metal Cloud
- Benchmarks
- Big Data Benchmarks
- Big Data Experts Interviews
- Big Data Technologies
- Big Data Use Cases
- Big Data Week
- Cloud
- Data Lake as a Service
- Databases
- Dedicated Servers
- Disaster Recovery
- Features
- Fun
- GoTech World
- Hadoop
- Healthcare
- Industry Standards
- Insurance
- Linux
- News
- NoSQL
- Online Retail
- People of Bigstep
- Performance for Big Data Apps
- Press
- Press Corner
- Security
- Tech Trends
- Tutorial
- What is Big Data
NoSQL Performance Benchmarks Series: Couchbase
This is the first of a series of performance benchmarks on NoSQL DBs that we plan to share with you. Our goal is to understand the various scaling profiles of distributed database technologies as well as identify environments that provide optimum performance/price. Many of our findings can be applied to on premise infrastructure as well and even some cloud scenarios.This performance benchmark on Couchbase shows sub-millisecond response times but also a difference between GET/PUT operations and QUERY operations when multiple instances are added to the cluster. We have also tested the Memory-Access-Time sensitivity of Couchbase.

This is the first of a series of performance benchmarks on NoSQL DBs that we plan to share with you. Our goal is to understand the various scaling profiles of distributed database technologies as well as identify environments that provide optimum performance/price. Many of our findings can be applied to on premise infrastructure as well and even some cloud scenarios.
This performance benchmark on Couchbase shows sub-millisecond response times but also a difference between GET/PUT operations and QUERY operations when multiple instances are added to the cluster. We have also tested the Memory-Access-Time sensitivity of Couchbase.
Hardware Setup
We used the following infrastructure for the tests:
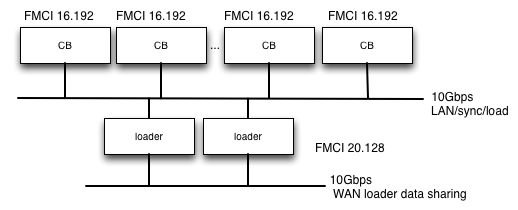
- - 10 FMCI 16.192 instances with 2 x Intel Xeon E5-2690 CPUs (8 physical cores at 2.9 GHz each) and 192 GB of RAM for Couchbase nodes.
- - 2 FMCI 20.128 instances with 2 x Intel Xeon E5-2690v2 CPUs (10 physical cores at 3 GHz each) and 128GB of RAM for JMeter loader nodes.
These nodes were connected with two independent 10 Gbps networks, one for the actual loading and inter-node communication and the other one for backend inter-loader communication. Also the nodes were connected to our Solid Store iSCSI Block Storage via a third independent 10 Gbps link per node.
Software Setup
We used Couchbase Enterprise 2.5.1. The loader software was Apache JMeter 2.11 with custom samplers written by us that are available at our github repository. The custom sampler instantiates the Couchbase client and then uses it to execute independent PUT, GET and then QUERY operations. The dataset is the Last.fm training dataset which has about one million JSON formatted records of songs. The nodes were added sequentially to the pool in increments of 2. The bucket that held the data was always deleted and recreated before running the tests. Also, the auto-compaction feature was disabled.
All the tests were executed using 1000 concurrent client threads that instantiate a separate client instance on each loader machine, which totals 2000 concurrent threads. The Couchbase clients discover the nodes participating in the cluster and connect to the individual nodes directly thus yielding more than 2000 concurrent connections to the cluster.
All the hosts had the fs.file-max ulimit increased to 55k. We have been running Centos 6.5. The data was aggregated from all loaders and saved in CSVs. The time series was then analysed using Octave. To test the Query performance we used the following map/reduce view:
Mapper function
function (doc, meta) {
  for(i=0;i<doc.tags.length;i++)
  {
    	if(doc.tags[i][0]=="electronic")
	  emit(meta.id, doc);
  }

}

reducer function:
_count
The view was also setup before running any other test.
Monitoring
This test is designed to verify cluster behavior under normal operating circumstances so the cluster was monitored permanently. No hardware limitation was hit during the tests. We used a combination of dstat, HTop, IOtop and Couchbase’s own UI to monitor all the hosts including the loaders. We have also made sure that the view was setup and published every time after a bucket has been re-created. We have also waited until the cluster has settled before starting the tests.
Results
| No. of Instances | 2 | 4 | 6 | 8 | 10 |
|---|---|---|---|---|---|
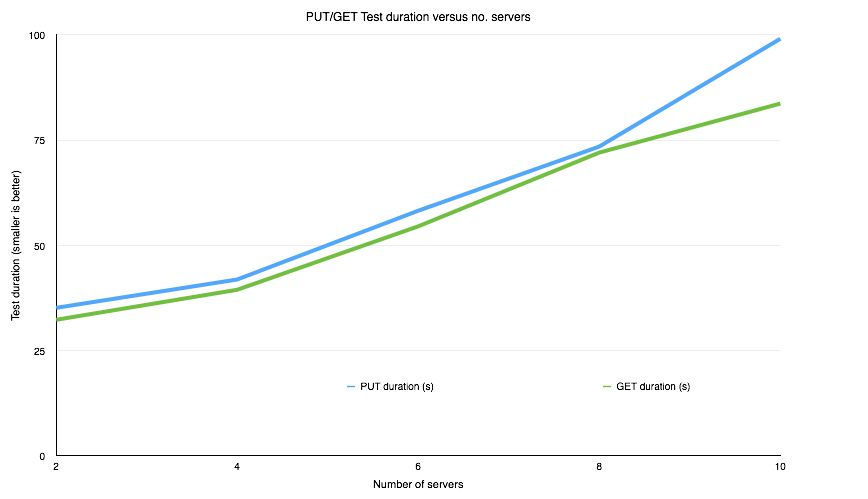
| PUT duration (s) | 35 | 42 | 58 | 73 | 99 |
| PUT est resp time (ms) | 0.035 | 0.042 | 0.058 | 0.073 | 0.099 |
| GET duration (s) | 32 | 39 | 55 | 72 | 84 |
| GET est rsp time (ms) | 0.032 | 0.039 | 0.055 | 0.072 | 0.084 |
| QUERY duration (s) | 209 | 131 | 134 | 133 | 141 |
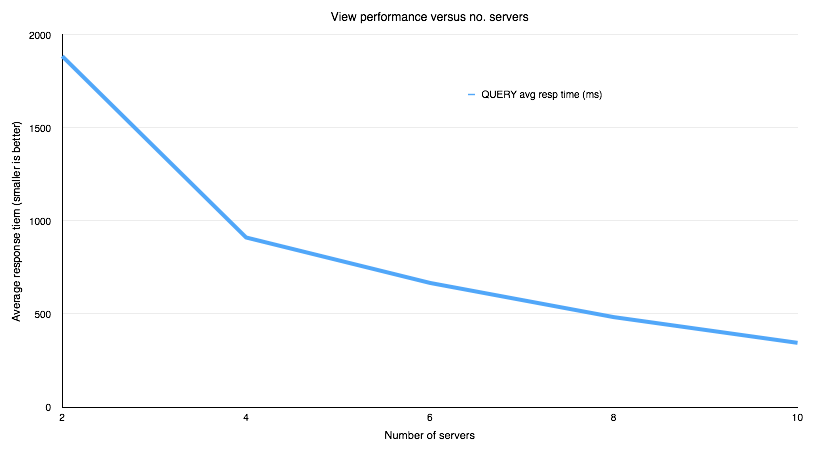
| QUERY avg resp time (ms) | 1886 | 911 | 667 | 483 | 345 |
As can be seen, the higher the number of compute instances, the higher the duration of GET and PUT operations, so lower performance overall. Our explanation for this is that each additional compute instance introduces additional network latency.
 Query performance on the other hand seems to increase linearly as we add servers, possibly due to map/reduce operations being highly parallel in nature. Also, since each operation takes more than 100 ms, the network latency impact is no longer visible.
How a PUT RUN looks like
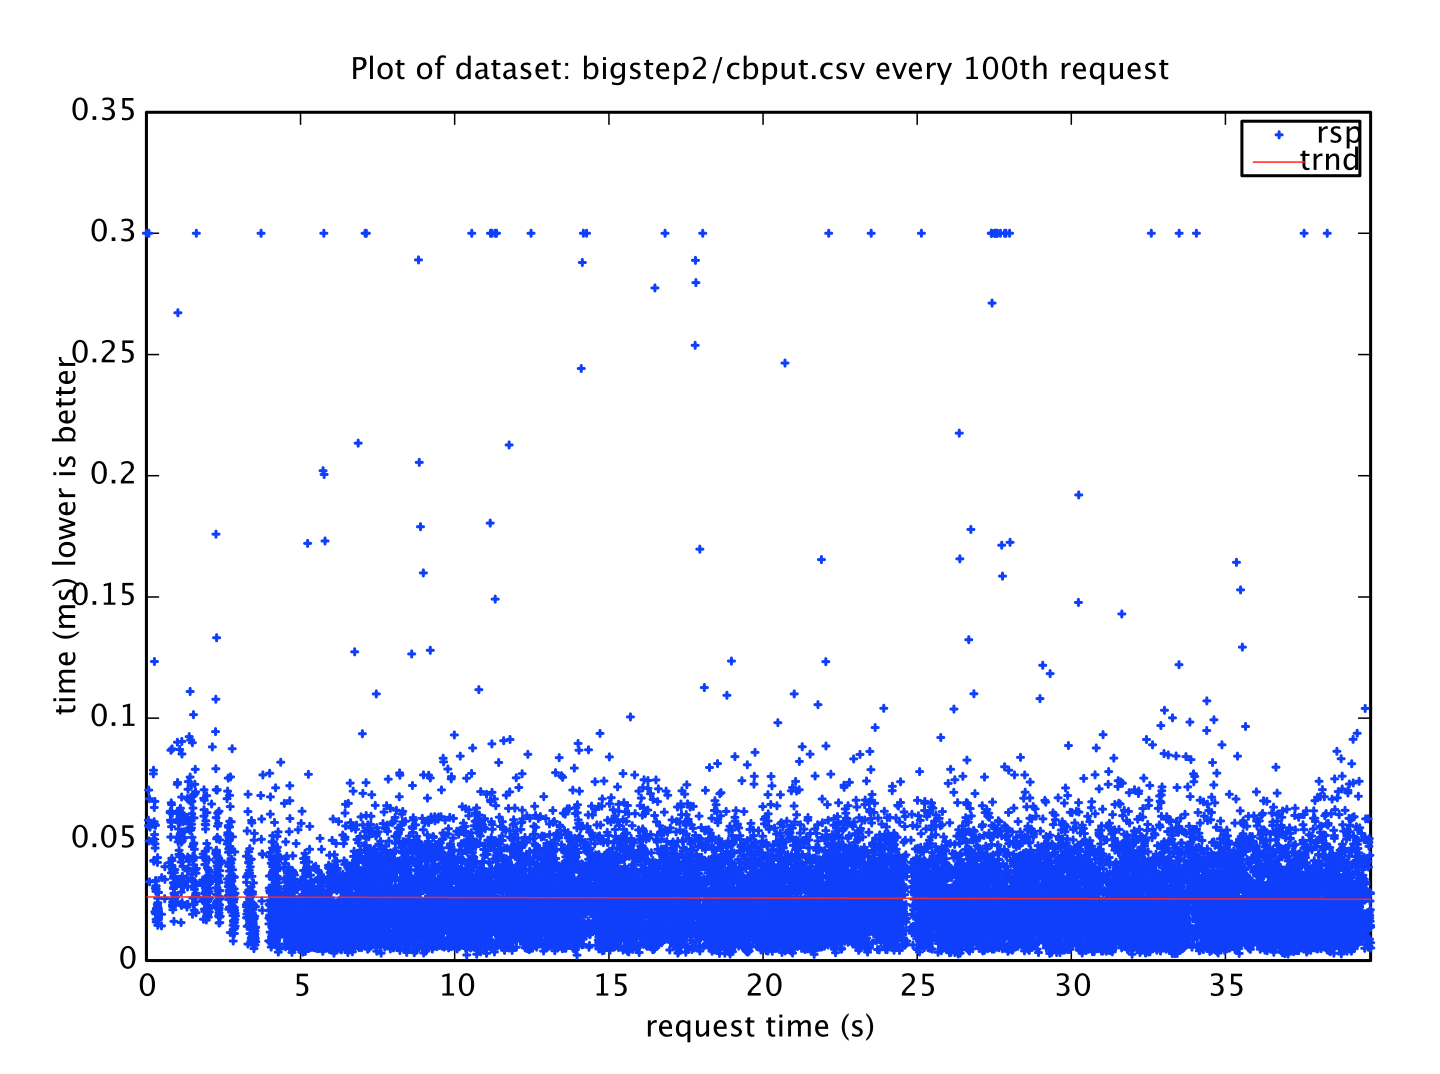
As JMeter does not support out of the box resolutions smaller than 1 millisecond we had to adjust our custom sampler to calculate and export the duration using System.nanoTime(). This allowed us to analyse the real response times in Octave. Below is a plot of one of the PUT runs. Also some outliners were removed.
How a GET RUN looks like
This is how a GET run looks like analysed in Octave. Again, we had to use the same sample result time from our custom sampler and also removed outliners. 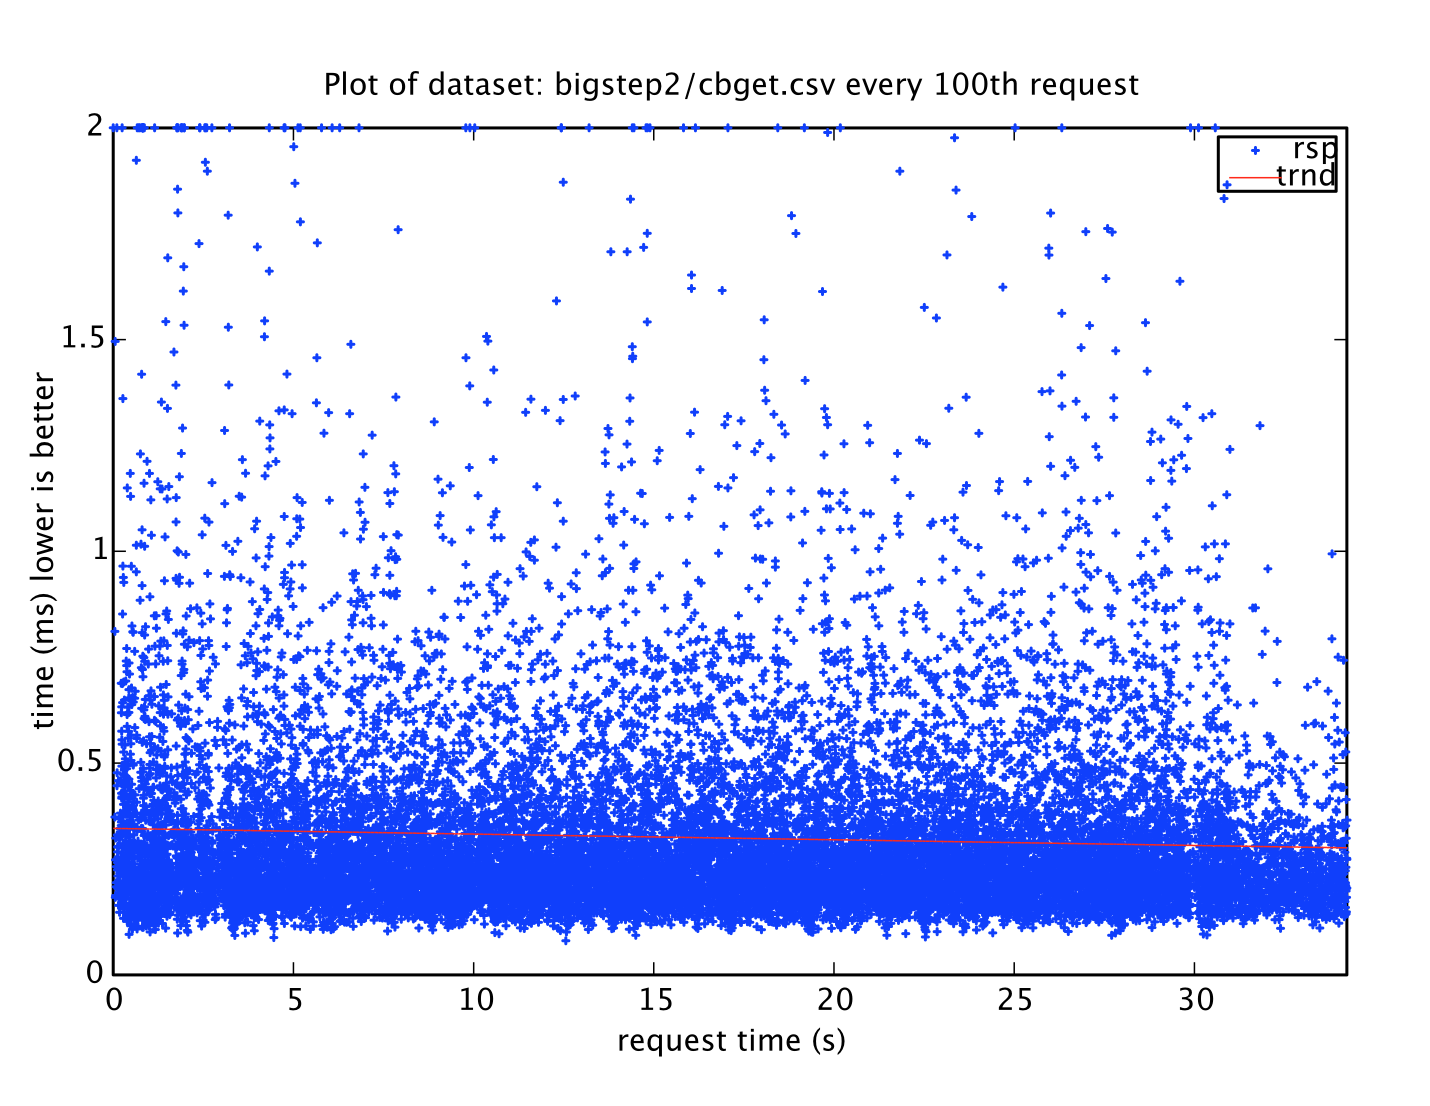
How a QUERY RUN looks like
Query runs on the other hand take a lot longer to execute so we don’t need the same sub-ms analysis. 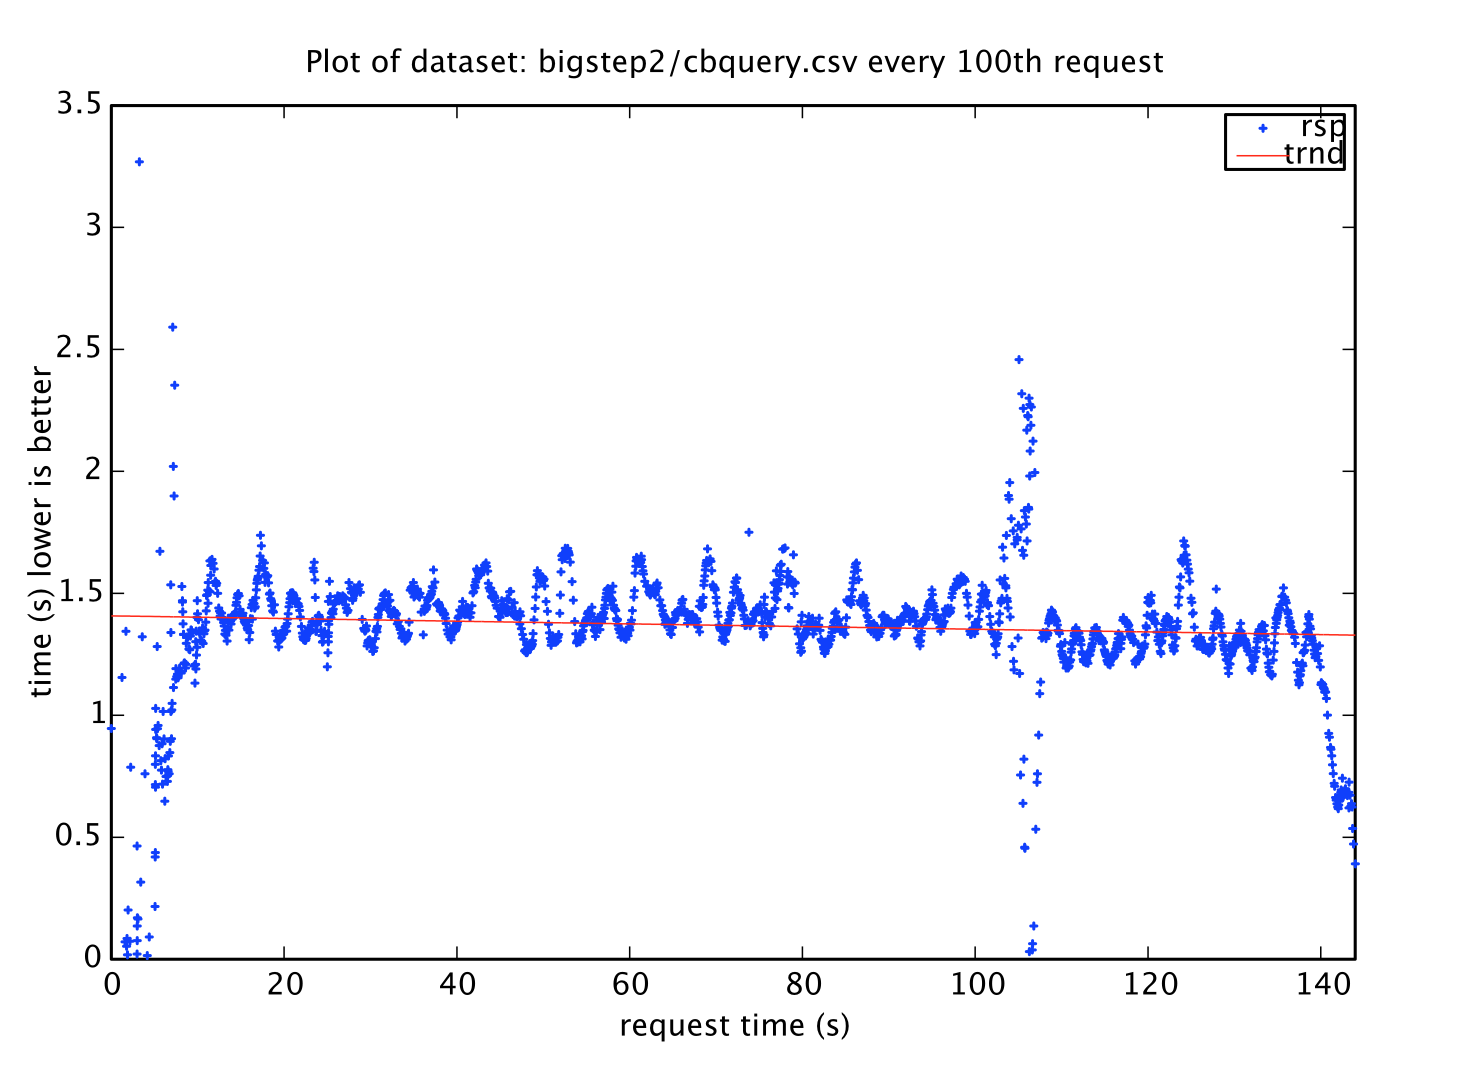
Performance-to-price ratio
We have also calculated the performance-to-price ratio. Since Couchbase has a very interesting scaling pattern as some metrics decrease and some increase as we add servers, we assigned a score to each of the three metrics we had (GET test duration, PUT test duration, QUERY average response time) and then we added them.  Pr - the price of an instance is in British Pounds per hour for a FMCI 16.192. N is the number of nodes.
| No. of Instances | 2 | 4 | 6 | 8 | 10 |
|---|---|---|---|---|---|
| GET Score | 1.00 | 0.82 | 0.59 | 0.45 | 0.39 |
| PUT Score | 1.00 | 0.84 | 0.60 | 0.48 | 0.35 |
| Query score | 0.18 | 0.38 | 0.52 | 0.71 | 1.00 |
| Score (query performance) | 2.18 | 2.04 | 1.71 | 1.64 | 1.74 |
| Price/h (GBP) | 4.28 | 8.56 | 12.84 | 17.12 | 21.4 |
| Price to perf | 0.51 | 0.24 | 0.13 | 0.10 | 0.08 |
This shows that the more nodes you have the less efficient you are in the way you’re spending money. Since the ratio between these operations is highly application specific the ratio will also look different. 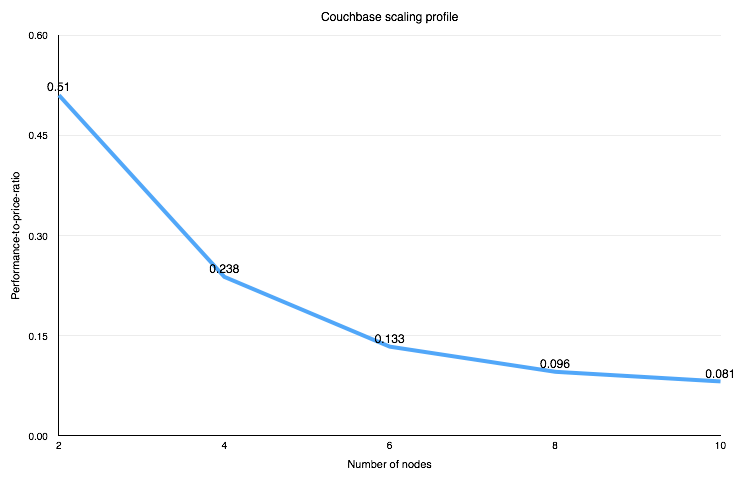
The impact of auto-compaction
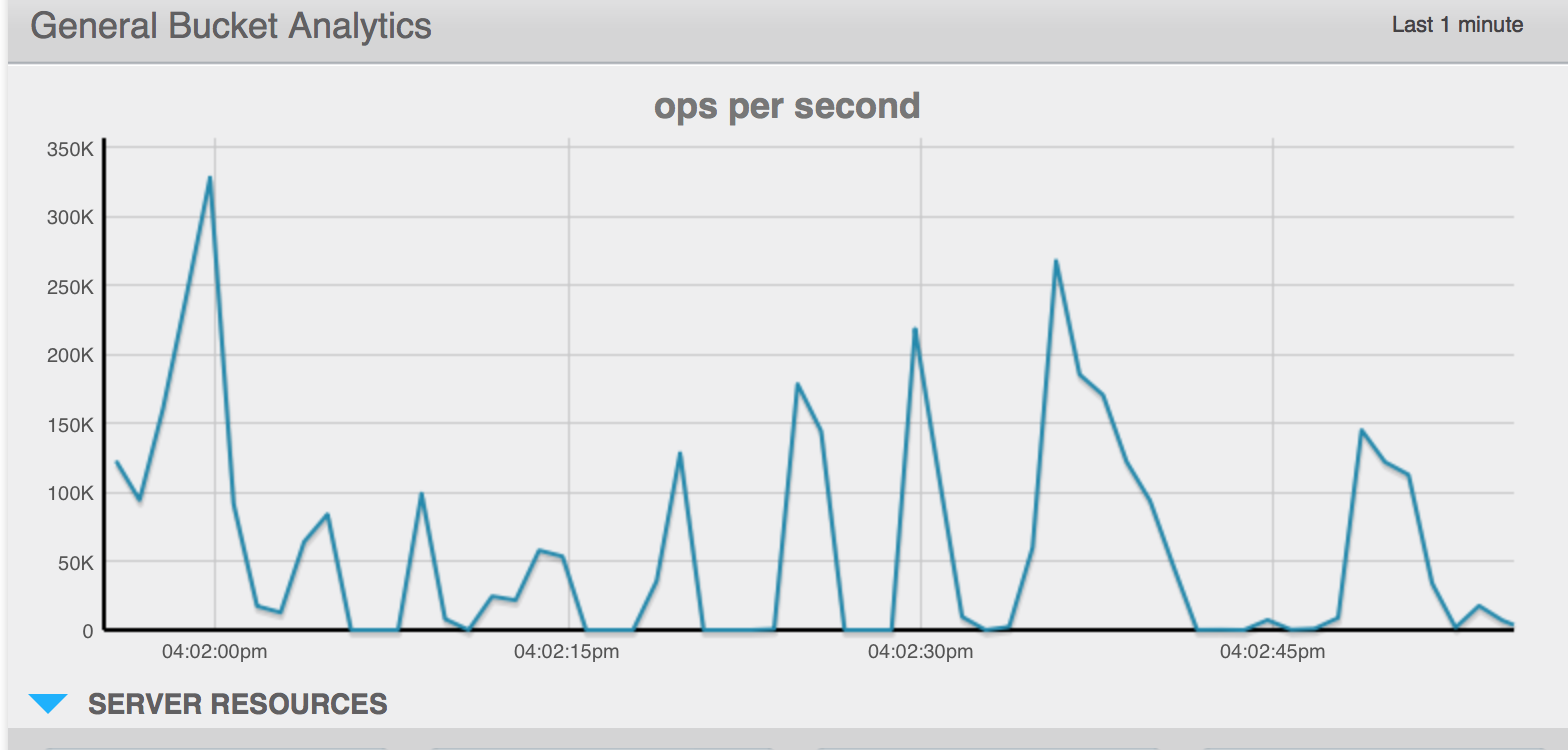
Couchbase is an append-only database and while this makes it always consistent and avoids data corruption, having an ever increasing file will eventually eat up all the available disk. This means that from time to time the database has to be “compacted”. We have studied the impact that the default auto-compacting setting has on a PUT series. As Couchbase documentation recommends, auto-compaction should only be enabled during off-peak hours as it generates high delays in the response times which should normally be under 1 ms. 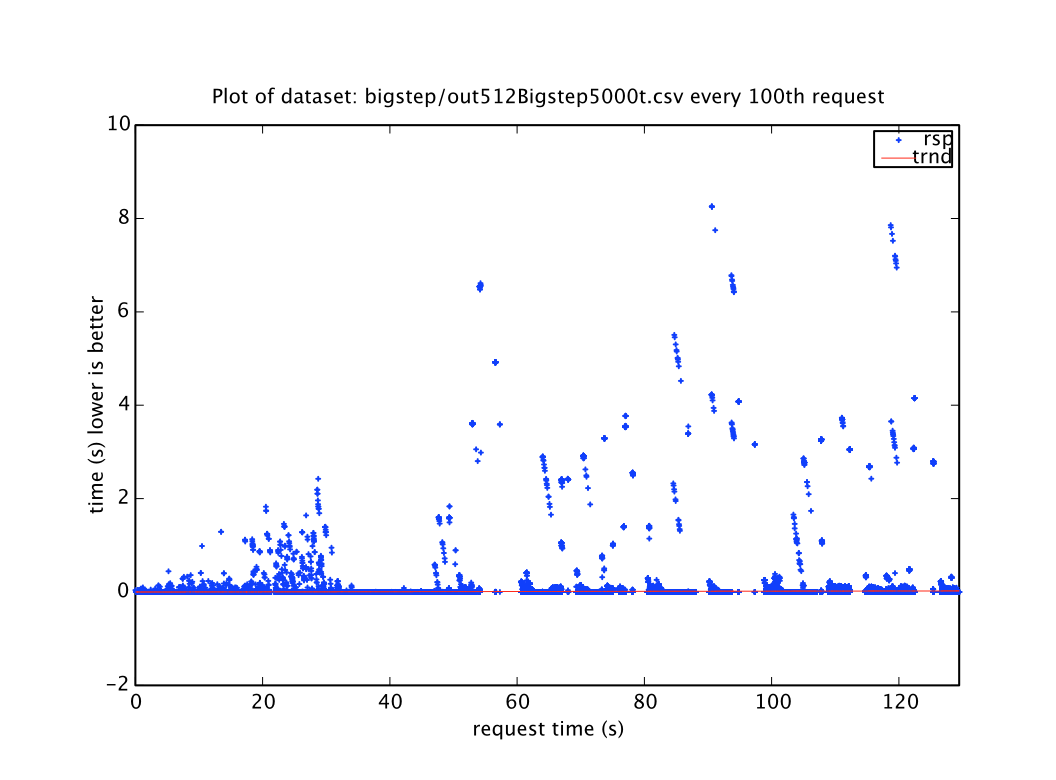
The impact of Virtualisation
Memory response time bound applications, such as NoSQL databases are heavily influenced by the memory memory access speed on the hosts . We have added a comparison between 2 FMCI 4.16 (16 GB RAM, Quad-Core Intel E3-1230v2 at 3.3 GHz ) and 2 m3.2xlarge (8 cores , 30 GB of RAM) instances - which are very similar in terms of specs. In both environments the loaders were residing on an additional 2 machines identical with the Couchbase machines. The following is a benchmark of the actual systems. We tested the time to read and write 1 TB into and from the RAM (using SysBench). We also show the results of the “threading” performance SysBench test. On our Bare Metal Cloud we were running on Centos 6.5 and on AWS we were running RHEL6.5. The commands we ran are:
sysbench --test=memory --num-threads=8 --memory-block-size=1M --memory-total-size=1T run
sysbench --test=threads --num-threads=8 --max-time=30s run
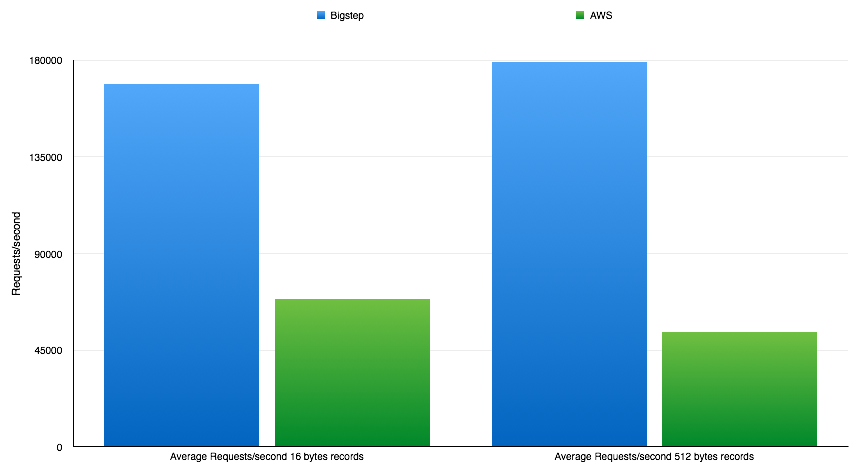
In both cases smaller is better. 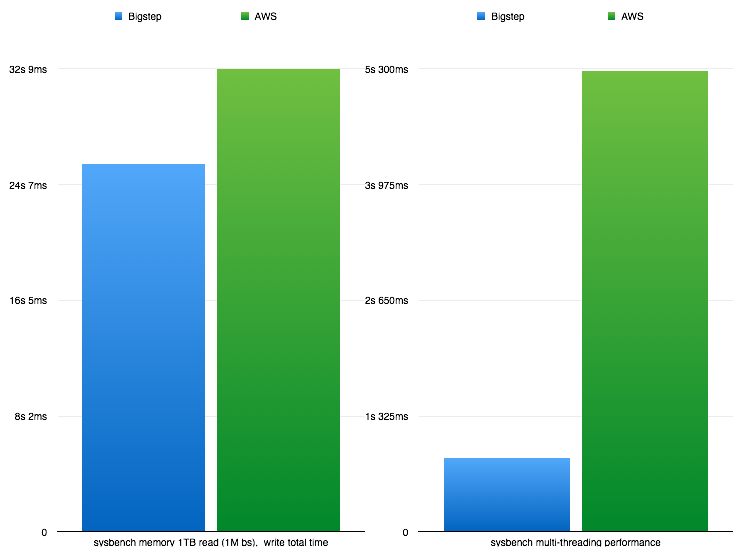 This is the impact of this discrepancy on Couchbase:
Conclusions
We have found out that Couchbase is very scalable but follows the same rules of diminishing returns as many distributed systems do. Nevertheless we managed to achieve up to 350k requests/second for atomic operations which makes it the highest performing database we have seen in our lab so far at least for this particular test.
We’ll be sharing more of our tests with you soon so tune in. In the meantime, let us know if you’ve worked with Couchbase and seen a different behavior or if there’s any particular database you’d like us to test next.
From The NoSQL Performance Benchmarks Series:
• NoSQL Performance Benchmarks Series: Couchdoop
• NoSQL Performance Benchmarks Series: Cassandra
Readers also enjoyed:

How To Benchmark NoSQL Databases


Leave a Reply
Your email address will not be published.