- Advertising
- Bare Metal
- Bare Metal Cloud
- Benchmarks
- Big Data Benchmarks
- Big Data Experts Interviews
- Big Data Technologies
- Big Data Use Cases
- Big Data Week
- Cloud
- Data Lake as a Service
- Databases
- Dedicated Servers
- Disaster Recovery
- Features
- Fun
- GoTech World
- Hadoop
- Healthcare
- Industry Standards
- Insurance
- Linux
- News
- NoSQL
- Online Retail
- People of Bigstep
- Performance for Big Data Apps
- Press
- Press Corner
- Security
- Tech Trends
- Tutorial
- What is Big Data
How To Benchmark NoSQL Databases

People make wrong design decisions all the time. Typical developers are under immense pressure to meet a deadline and they very often just take gut decisions and choose technologies they haven’t worked with before because they sound good on paper. The vice-versa is also often true, senior developers go with proven technologies and their known pitfalls because they simply don’t think other technologies can be better.
There are two ways to get a feel of your environment’s performance profile:
1. Wait and see what happens
2. Benchmark
Option number 1 is often chosen although getting married to a bad technology as many people have found out the hard way is very expensive. It’s not the servers or the licensing for the technology, it’s the time involved in developing something around it. Just imagine spending 6 months developing around the wrong NoSQL technology with a team of 4 senior developers. That can easily get you to $200k of wasted burned capital not to mention the stress of migrating data between incompatible data types, lost customers due to outages or bad UX.
Hardware is often neglected. Cloud marketing has made it so bad nowadays that people think all cores are about equal and all RAMs are the same. The network latency is neglected and the storage layer is really just about SSD vs Spindle. We’ve seen orders of magnitude variances in the performance yielded by various cloud providers with the same price and configuration.
Benchmarking a system is actually not that complicated.
1. Takes 1-2 weeks.
2. Involves about 10-20 instances. You can draw conclusions based on that but you can also test with more if the tests seem inconclusive. You typically run all the instances for just a few days and should be under $1k depending on your instances.
What is the performance profile
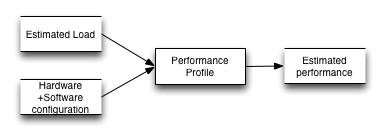
Our goal is to be able to estimate the performance of a system given a specific load and a hardware configuration before we have it actually in production.
Your goal is to find out what is the performance profile of a software+hardware setup. A performance profile is a model of the production environment that you can use to estimate the performance given an load and a number of instances.
It doesn’t have to be a mathematical model. It just has to provide enough information so that someone will be able to use it to estimate performance given a specific hardware configuration and a load level.
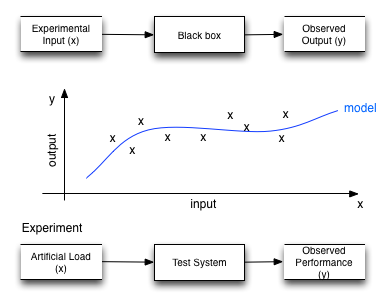
This performance profile is derived from treating the system as a black box, feeding it repeated inputs and observing the output. From all the experiments an empirical model can be deduced.
The more experiments we run the better the model. Notice that at the input of the performance profile is also the hardware configuration. To be able to deduce the relationship between hardware configuration and the performance of the system (also called Scaling Profile) experiments must also vary the hardware configuration.
Preparing for the tests
1. Run the getting started. If you haven’t done that already get your client code and experiment with it if you can. Read a bit about the architecture and go through the getting started guide. Use a VM on your laptop at this stage. Try to save the actual commands you used to install stuff (eg yum install something) in a ‘notes’ file. You will need them later on the actual testing servers and also if somebody asks about versions and dependencies such as JVM version. This part will take you at least a couple of days. It’s ok. It’s part of the test.
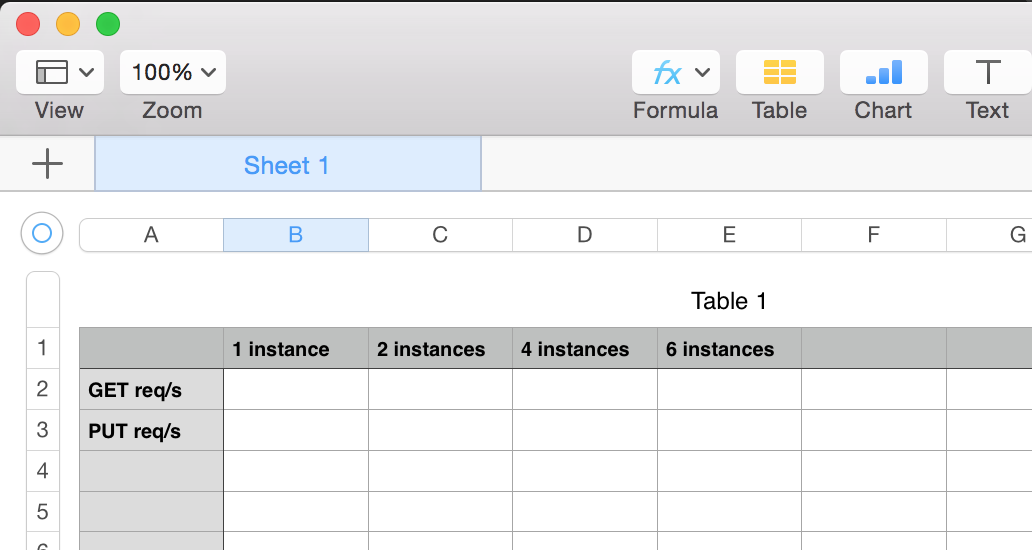
2. Describe your objectives. I’ve found out that writing an excel table header right from the start with the actual cells that need to be filled in helps a lot. This table might evolve over time. You’ll have many sheets with test runs and such so it’s good to get organised from the start.
3. Think about the architecture of the tests. For high performance applications you usually need to have at least 1:1 ratio of loaders to target nodes. So if you test 5 cassandra nodes you need at least another 5 nodes to actually drive the load. This is because a lot of these technologies rely on the client to do hashing and some of the processing.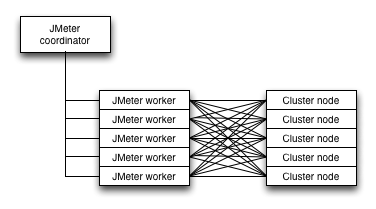
4. Understand your hardware. Write down the specs in the notes file. Find out virtualisation technologies used, bandwidth capacities and limits of your storage (for the instance types you want to start benchmarking).
Setup JMeter
I don’t recommend using the benchmarking tools that come with the database or technology in question. It might be way easier to get started but understanding how the client behaves (like the Cassandra driver or the Couchbase client) is key to making a correct assessment of the technology. Often things like the way hashing is setup are critical to the performance and it’s important that you are not abstracted away from those details. Also those benchmark tools are not scalable, they typically cannot be ran properly over multiple machines and cannot be used with real data.
In my opinion JMeter is by far the best generic benchmarking tool out there:
1. It’s scalable. You run agents on many servers and have them all load up the target servers.
2. It’s powerful. You can setup very complicated tests with things like reading data from CSVs and using it as variables, making decisions based on retrieved data, recording traffic and replying it and a lot more. Don’t say you don’t need it, you will.
3. It’s plugin-able. You can write your own code. Simple to write, simple to understand.
You could go with the binaries but then you can’t put your own code in there. Get the source. To compile you’ll need java and ant installed on your machine. Notice that it’s your machine not the VM or a VM with X. You need the GUI otherwise it’s going to be complicated to setup the test file. We’ll use the UI-less version later on.
[bash]
$ wget http://www.eu.apache.org/dist//jmeter/source/apache-jmeter-2.12_src.tgz
$ tar -zxf apache-jmeter-2.12_src.tgz
$ cd apache-jmeter-2.12
$ ant download_jars
$ ant
....
BUILD SUCCESSFUL
$ sh ./bin/jmeter
[/bash]
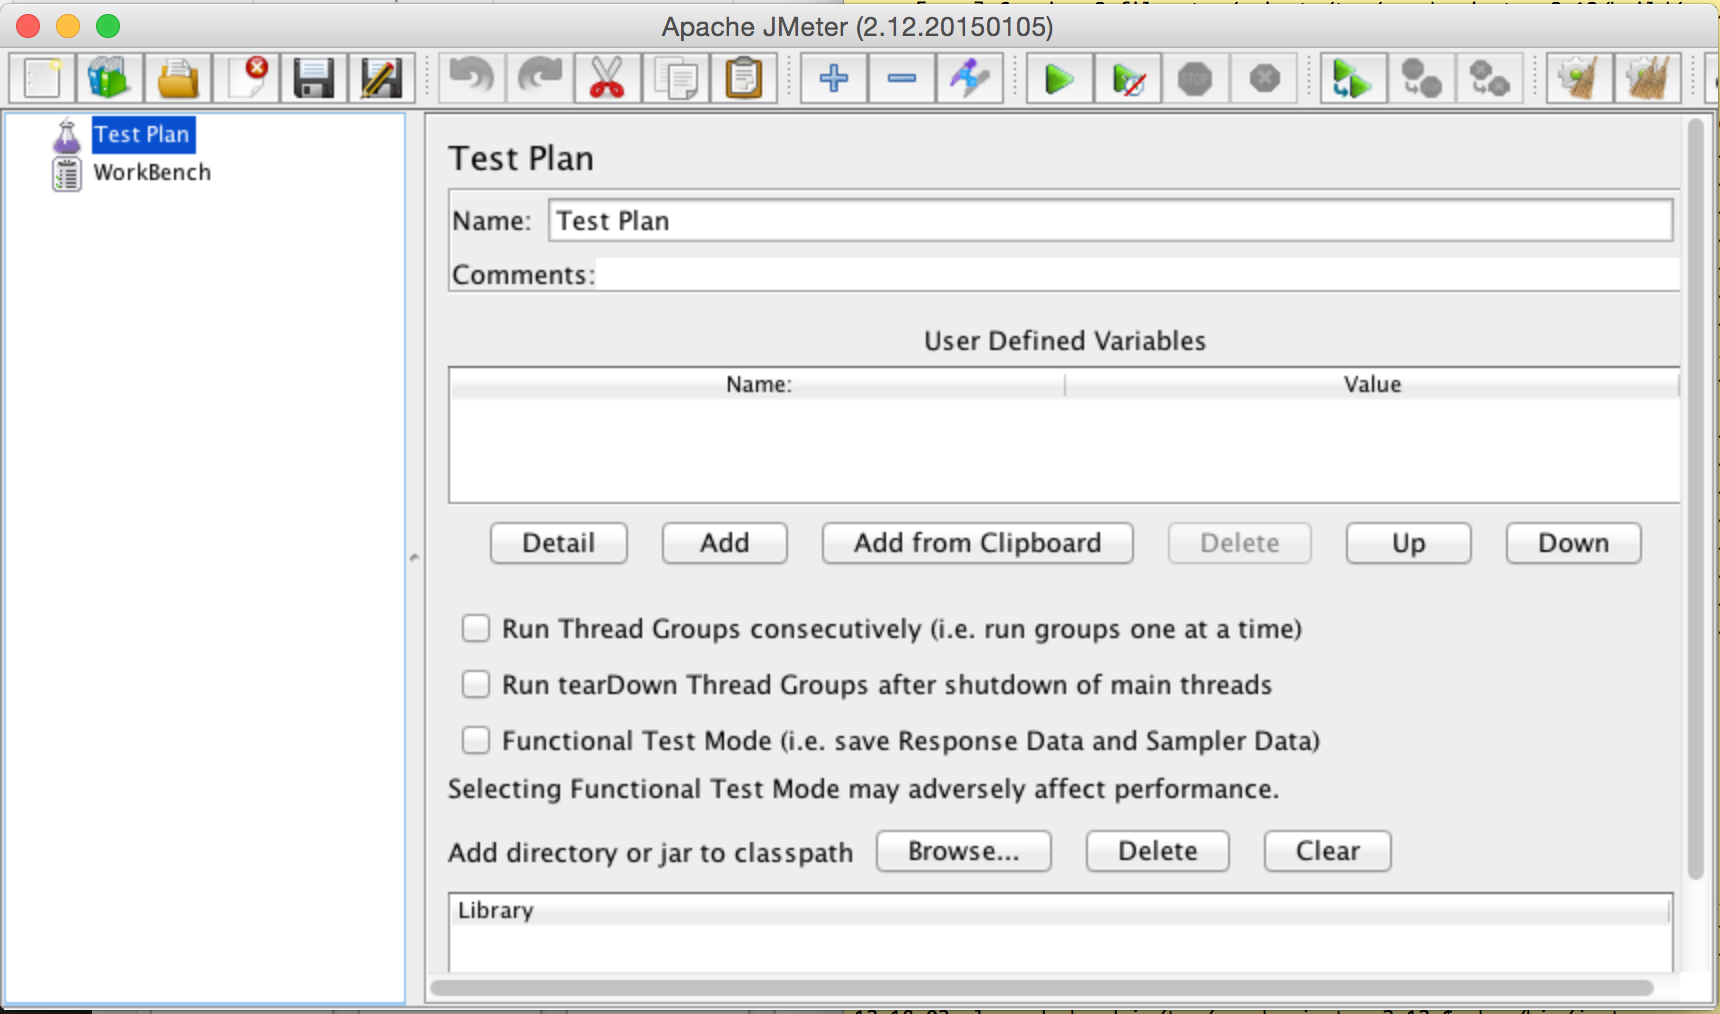
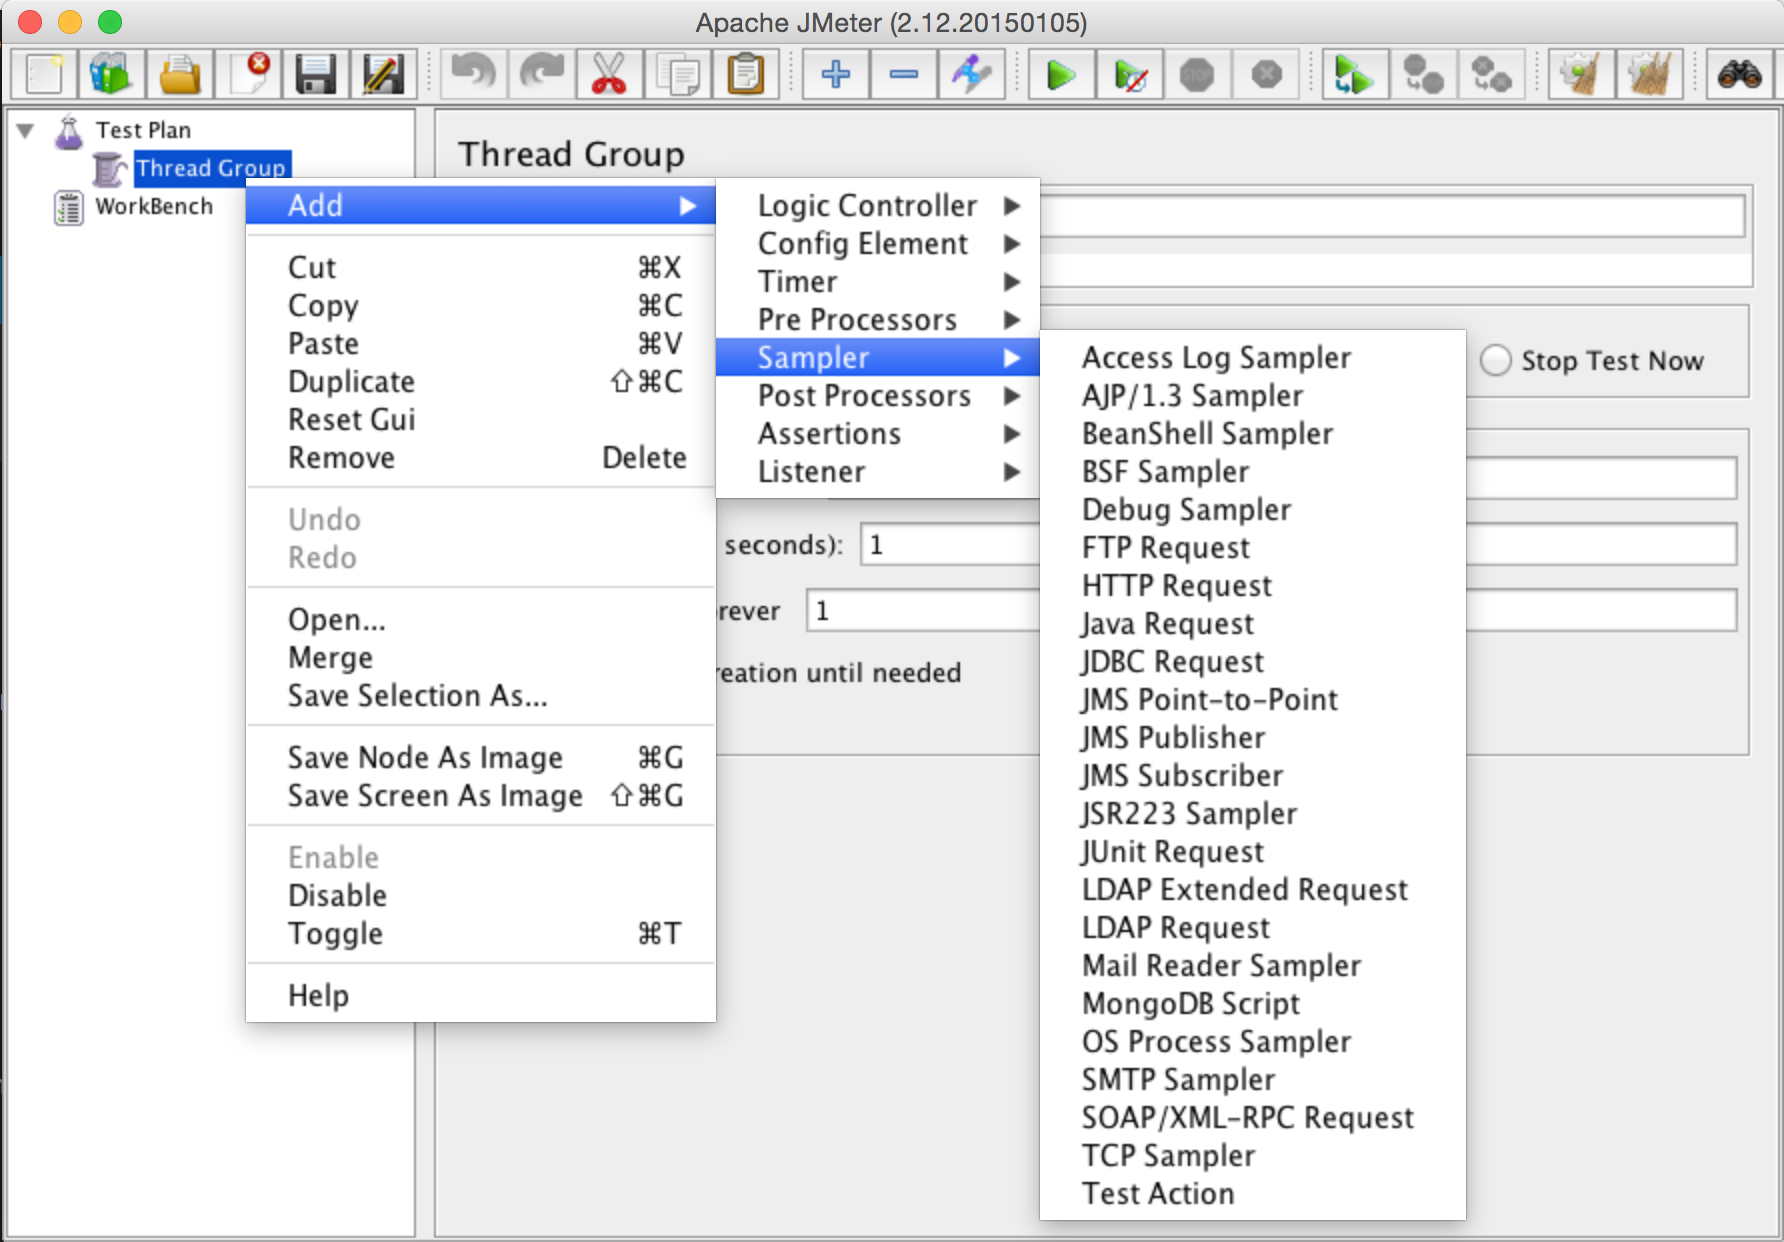
Jmeter has a learning curve similar to VIMs. It’s frustrating at first but once you get a hang of it it’s awesome. A getting started guide is here. If the TL;DR syndrome kicks in. Just right click on the Test Plan, select Add, Threads, Thread Group. And then right click the Thread Group, and take a look at the Sampler menu.
So it can do a lot of stuff with it. All the other menus allow you to control the way you do the sampling, delays, loops, etc. If your database is not listed, don’t worry, that’s why we have the source.
At the very least you will need a thread group and a sampler. A thread group is a collection of threads. You specify how many threads you wish to have simultaneously (think concurrent clients) and how many times the entire test is to be ran. We’ll talk about this later on.
Writing a customer sampler for jMeter
The sampler is where the magic happens. You’ll need to either choose one and set it up or if your technology is not already listed and even if it is I encourage you to write a custom sampler anyway. It’s easy to do.
It’s not necessary to start from scratch. We have a series of samplers already written for Cassandra and Couchbase. Here is a guide on how to write the tests but they are quite self explanatory.
Basically put a java source file in src/protocol/java/org/apache/jmeter/protocol/java/sampler/. You have to have a class derived from AbstractJavaSamplerClient that implements a series of abstract methods: getDefaultParameters, setupTest, teardownTest, runTest.
To set the default values (and also tell the GUI which are your input variables) use:
[java]
String cluster_contact_points = context.getParameter( "cluster_contact_points" );
[/java]
To get params in from the client (like the IPs of the servers to connect to), use:
[java]
String cluster_contact_points = context.getParameter( "cluster_contact_points")
[/java]
Instantiate the client in the setupTest (the code here is from the Cassandra client instantiation)
[java]
Cluster.Builder cluster_builder = Cluster.builder();
String cluster_contact_points = context.getParameter( "cluster_contact_points" );
for(String contact_point : cluster_contact_points.split(","))
cluster_builder.addContactPoint(contact_point);
this.casCluster = cluster_builder.build();
String schema = context.getParameter( "schema" );
this.casSession = this.casCluster.connect(schema);
[/java]
and tear it down in the teardownTest function.
[java]
if(null!=this.casCluster)
this.casCluster.close();
[/java]
Compiling and test runs
To re-compile simply run ant again. Don’t forget to add your sdk jars (such as the cassandra sdk jars) to the classpath. Add them in both lib/opt and lib.
Run your fist tests using the GUI JMeter and the VM on your computer. Set it up, run it using the green play button. Wait until it finishes. Use a Listener such as View Results Tree to debug the samples. Use Aggregate Report to view the results of all the runs. Please note that on ‘production’ tests you should disable these listeners.
There is a file called ./bin/jmeter.properties that has the logging setup. You can change it to debug to get more information. The log file is usually in the file called jmeter.log in the root of the jmeter dir.
[bash]
log_level.jmeter=DEBUG
log_level.com.bigstep=DEBUG
log_level.jmeter.junit=DEBUG
[/bash]
Run it until you have an error rate of 0%. Make sure your sampler throws errors. Give it some false data to see if it throws errors.
This is probably where you’ll spend some time. Usually the DB is not properly setup, the schema isn’t loaded, the query isn’t properly formatted etc.
Save your test jmx file and have it handy.
Prepare the ‘production’ testing environment
Now you are prepared to actually do the tests. Go to your cloud provider and deploy your infrastructure. Loaders and target servers. I like to use cssh (csshx on mac) to work with all of the servers simultaneously.
Configure the target servers with a cluster of your particular technology. Pull up your notes file and use what’s written there. Also add additional stuff that you need to actually setup the entire cluster.
Pay attention to the ip range. It’s best to use a private LAN with private IPs if possible.
On the target servers install java and copy the compiled source tree of our jmeter.
Run jmeter as a server on the loader servers servers. Sometimes I write a bash code to start jmeter on all of the loaders. You’ll need to restart this often.
[bash]
sh ./bin/jmeter -s &
[/bash]
Start dstat on the servers to see what’s happening. It’s important to monitor the loaders as well.
[bash]
dstat -cdnm
[/bash]
Run the coordinating JMeter with the IPs of all of the loader servers. Make sure the servers can see each other bothways. I.e. NAT won’t work. Jmeter will spit out a huge csv file with all the samples. It’s good to put the csv file in /dev/shm as it will stress your storage system and you will want to move it around.
I use octave to analyse the results of the tests. This is an open source version of MathLab. The m files can be downloaded from github.
[bash]
sh ./bin/jmeter.sh -n -t ../cbtest1.jmx -R 84.40.62.55,84.40.62.56,84.40.62.57,84.40.62.58,84.40.62.59 -l ../out.csv
[/bash]
If you don’t want that level of control over how the results come back. Just run your coordinating jmeter on a machine with X and have it display the results in listeners.
Important considerations
1. The software layer must be setup as close as possible to how a production environment would look like: Data schema should resemble the production schema if possible or at least have the same complexity, the same major versions should be used and the client libraries that are going to be used in production should also be used for the tests.
2. The hardware configuration should ideally be the same as the production one albeit with less servers but with similar instance types.
3. Instances always need to be monitored for raw performance metrics: CPU, memory pressure, network metrics, storage iops or bandwidth. I typically use dstat.
4. A test run is valid if:
a) it maxes out or gets close to maxing out of the metrics (CPU, RAM, NETWORK or Storage Bandwidth)
b) the system is stable during the load (error rate is 0%). You might have some tolerance here and get 0.1%.
5. Write a good test report. I’ve often found that when you get into an argument and you show the test results advocates of other solutions will want to debunk your findings. They will look at things to invalidate your tests even if the results are correct. If they succeed all this work would have been for nothing.
6. Tests need to be reproducible, meaning somebody else with an identical scenario should have enough information from your test report to replicate the tests and get fairly similar results. Scientists often do replicate the experiments.
7. Keep a good test hygiene. Think like a scientist. Think about what could contaminate your experiments, what other scientists might ask, what you would ask from another scientist if you would see his white paper describing this test.
Further reading
A very good read, that is at the basis of everything I’ve tested so far is Performance Testing Guidance for Web Applications written by Microsoft. Also try to read articles on how not to benchmark technologies like How not to benchmark Cassandra.
If you have any questions for us, just drop us a comment and we’ll do our best to answer.
Readers also enjoyed:

The Cloud Isn't the Only Reason You Need NoSQL


Leave a Reply
Your email address will not be published.